2018 ended. For many, memories. For us, numbers. Therefore, we are bringing here a project shared between Brazilian, Finnish, German and Spanish fansites to the world: the Game Balance.

The Balance is the summarization of records of players' activities, such as registered users, created rooms and purchased groups from each hotel. The numbers obtained are compared to the previous year to check the performance of Habbo. We understand that these numbers reveal how engaged the users are with the game.
Criteria for data collection
We used the time zone of each hotel to find the first and last records of its respective community. Note that Habbo uses two time zones: the Greenwich Mean Time and the local time zone for each hotel. For this reason you will notice that there is a divergence of dates inside and outside the Hotel. Click here to see an example.
For this analysis were considered all records of the year: this includes banned and fake users, rooms and excluded groups. If it existed at some point, it was accounted for. It is unfeasible to know who and how many users are banned or excluded groups and rooms, for example. Moreover, this is irrelevant to the analysis and does not interfere with the final results.
THE BIG DATA
The data below were organized by subject in the form of Habbo overview and are all we were able to collect and analyze. We provide the data with more details of each hotel to the local fansites. You can see them at the end of this article.
Users
In 2018, 4,267,387 users worldwide were registered in Habbo. In all hotels there was a drop in total registered players. Overall, the decline was 20.5%. Below, the number of registered users in each hotel and the oscillation in relation to the previous year.
| Hotel | Total | Oscillation (%) | |
| Habbo.com.br | 1,683,164 | -19.9 | |
| Habbo.de | 100,358 | -19.7 | |
| Habbo.es | 969,143 | -13.4 | |
| Habbo.fi | 52,413 | -7.3 | |
| Habbo.fr | 249,512 | -16.3 | |
| Habbo.it | 83,192 | -26.9 | |
| Habbo.nl | 134,282 | -27.6 | |
| Habbo.com.tr | 271,717 | -23.1 | |
| Habbo.com | 723,606 | -28.7 |
Since 2013, a year after the Sulake adopt drastic changes in the direction of Habbo, the number of users, globally, is steady fall. Of course, the disappearance of advertising campaigns has this the main reason. Of course, the absence (or nonexistence) of advertising campaigns has influenced the number of active players in the community.

Fakes? Yes, we have found many. We are unable to say for what reasons each of them was created. However, we find that in the middle and end of each year, exactly the holiday period in many countries and the arrival of the advent calendar, the number of new users increases significantly.
Does any of your users include in this number?
![]() Habbo.com.br
Habbo.com.br

![]() Habbo.de
Habbo.de

![]() Habbo.es
Habbo.es

![]() Habbo.fi
Habbo.fi

![]() Habbo.fr
Habbo.fr

![]() Habbo.it
Habbo.it

![]() Habbo.nl
Habbo.nl

![]() Habbo.com.tr
Habbo.com.tr

![]() Habbo.com
Habbo.com

Groups
Decrement also recorded in the total of groups sold in Habbo. There were 80,033 purchased throughout 2018 worldwide. That's down 18%.
| Hotel | Total | Oscillation (%) | |
| Habbo.com.br | 25,898 | -23.8 | |
| Habbo.de | 2,943 | -25.5 | |
| Habbo.es | 16,802 | -14 | |
| Habbo.fi | 860 | -5.1 | |
| Habbo.fr | 5,933 | -15.9 | |
| Habbo.it | 1,304 | -39.2 | |
| Habbo.nl | 4,081 | -33.7 | |
| Habbo.com.tr | 6,068 | +45.6 | |
| Habbo.com | 16,344 | -21.8 |
While Habbo.it achieved the sharpest drop of almost 40%, Habbo.com.tr stands out as the only hotel to close the positive balance. 
Creating a group is not as easy as creating a user or a room. You must be a member of Habbo Club and buy your group for 10 credits. In 2018, users spent 802,330 credits buying groups.
Unfortunately we are not able to calculate additional items for groups such as furniture and forums.
![]() Habbo.com.br
Habbo.com.br

![]() Habbo.de
Habbo.de

![]() Habbo.es
Habbo.es

![]() Habbo.fi
Habbo.fi

![]() Habbo.fr
Habbo.fr

![]() Habbo.it
Habbo.it

![]() Habbo.nl
Habbo.nl

![]() Habbo.com.tr
Habbo.com.tr

![]() Habbo.com
Habbo.com

Rooms
The total of rooms is directly related to the total of active users: if there are more users, there are more rooms and vice versa. Many of these are from noob users, but mostly created by players to develop their favorite activities in Habbo. Users (and also staffs) created 5,789,316 rooms in 2018. This means 23.2% less than the previous year.
| Hotel | Total | Oscillation (%) | |
| Habbo.com.br | 2,252,341 | -25.1 | |
| Habbo.de | 140,682 | -24.5 | |
| Habbo.es | 1,324,795 | -16.9 | |
| Habbo.fi | 69,077 | -20.4 | |
| Habbo.fr | 323,819 | -16.9 | |
| Habbo.it | 106,443 | -26.3 | |
| Habbo.nl | 186,614 | -27.1 | |
| Habbo.com.tr | 554,381 | -22.8 | |
| Habbo.com | 831,164 | -27.1 |
![]() Habbo.com.br
Habbo.com.br

![]() Habbo.de
Habbo.de

![]() Habbo.es
Habbo.es

![]() Habbo.fi
Habbo.fi

![]() Habbo.fr
Habbo.fr

![]() Habbo.it
Habbo.it

![]() Habbo.nl
Habbo.nl

![]() Habbo.com.tr
Habbo.com.tr

![]() Habbo.com
Habbo.com

Limited Edition Rares
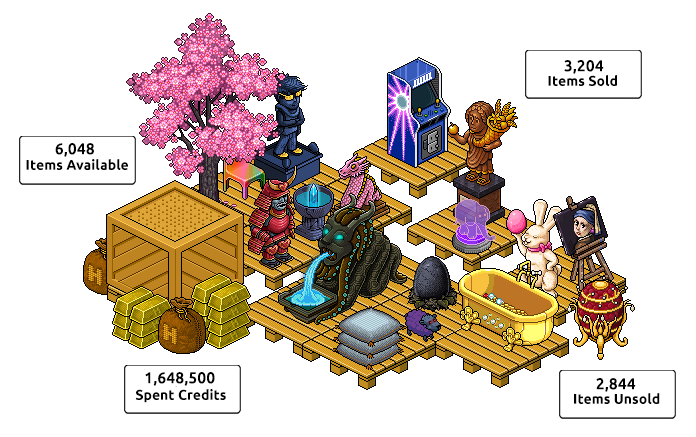
We also have data from the Limited Edition Rares (LTD). Below, the table lists the amount of items sold, coins spent and the selling rate of the LTD rares of each hotel in 2018.
| Hotel | Items Sold | Coins Spent | Selling Rate (%) | |
| Habbo.com.br | 208 | 99,000 | 21.3 | |
| Habbo.de | 496 | 267,500 | 65.6 | |
| Habbo.es | 446 | 227,250 | 45.8 | |
| Habbo.fi | 104 | 52,500 | 48.1 | |
| Habbo.fr | 354 | 195,250 | 54.6 | |
| Habbo.it | 133 | 64,500 | 41 | |
| Habbo.nl | 221 | 112,250 | 34.1 | |
| Habbo.com.tr | 126 | 72,250 | 38.8 | |
| Habbo.com | 1,116 | 558,000 | 93.9 |
Note that Habbo.com.br, the largest hotel, has the worst selling rate. Habbo.com surprises with more than 90% of the rare sold. Overall, this sales rate was 52.9% - there was a decrease of 1.8% in relation to the previous year.
From these data, it is possible to get some curiosities.
Global

Best Selling
The Butterfly Habberge Egg had 70.2% of the items sold.

Code: easter_ltd18_habberge10
Release date: March 15, 2018
672 items available
472 items sold
354,000 coins spent
If you want to know more curiosities about the LTD rares, visit the main article clicking here.
Habbo Club Payday 
On the 15th of each month, members of Habbo Club receives a payment for loyalty to the club and a percentage proportional to what was spent at the Shop. Traditionally, Habbo releases some data from HC Payday on Twitter and we also store it in our database.
According to Habbo, this year 9,250,590 credits were paid worldwide. This value is 7.5% lower than in 2017.
The best payment was in August: 937,915 credits paid in one go.
Below, the amounts paid month to month compared to the previous year.
| Month | Credits | Oscillation (%) |
| January | 860,021 | -24.7 |
| February | 680,271 | -17.3 |
| March | 686,188 | -13.9 |
| April | 825,528 | +0.9 |
| May | 660,782 | -14.7 |
| June | 758,007 | -5.5 |
| July | 833,212 | -6.2 |
| August | 937,915 | +20.7 |
| September | 858,048 | -7 |
| October | 618,099 | -12.2 |
| November | 763,304 | +8.2 |
| December | 769,215 | -8.2 |
In April, a user from Habbo.com shared the HC historical payment series on Twitter. You can remember here.
We should thank all those who somehow helped us in this great research. After all, it's not an easy job to collect and analyze so much data and make it visually pleasing from images and texts translated into multiple languages.
![]() Rob.Cuffe Motivo.ban
Rob.Cuffe Motivo.ban
![]() Cinoplex Ne.ko
Cinoplex Ne.ko
![]() AlexGeek
AlexGeek
![]() @Justeeri@ Happitorini
@Justeeri@ Happitorini
![]() petiMr Lordalzx
petiMr Lordalzx
![]() Carboteck Nickmania
Carboteck Nickmania
![]() Ernst
Ernst
![]() Droube
Droube
Game Balance Media Kit
If you would like to use some image on your fan site, blog or Twitter, we host all the material used in this news in Google Drive.
You can use it freely.

3 replies on “Habbo Statistics 2018 - Habbo”
Good job! a really useful and interesting information.
Guys awesome work as always. ☆ You mentioned the lack of advertising, what other factors would you suggest to bring the game back? Like create an in-depth customer study of game expectations, appeal for some partnerships... (?) felt it needed some conclusion/ action plan
Advertising has evidently been the main factor for the downfall of users, but I believe no business should bet its strategies on a single direction. Sulake must think about the strategies that offer the most potential. I believe that new partnerships would be a good idea.