
Welcome 2023. Before generating expectations about how will be the year that just started, we should keep in mind the facts of the past year. Because that we are releasing the Habbo Statistics 2022.
The Habbo Statistics project presents a summary of all records produced by users in 2022, from the first to the last second, even those that were subsequently permanently removed. The data is compared in percentage with the same period of 2021, within the local time zone of each hotel. This review does not consider Habbo X, the NFT version of the hotel, which is still in development.
For these statistics, as well as for previous years, you must take into account that it is not always possible to obtain exact numbers, due to records that cannot be located at the time of analysis, either because they are hidden or deleted. However, the accuracy of the data is greater than 99%.
Avatars
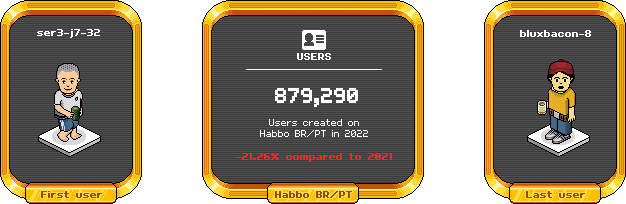
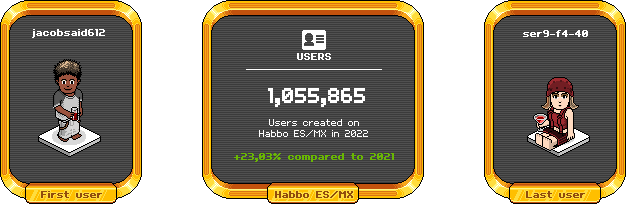
Habbo repeats a downward trend in registration of new avatars for the second consecutive year. In 2022, Habbo.es was the only one to grow at a fast pace and took over the position of the hotel where the most new avatars are registered, while Habbo.com.br came in second, for the first time below 1 million.
Considering all nine communities together, there were 2,759,921 new avatars in 2022, a 13.31% decrease compared to 2021.
| Hotel | Total | Oscillation (%) | |
| Habbo.com.br | 879,290 | ▼ 21.26 | |
| Habbo.de | 53,512 | ▼ 16.97 | |
| Habbo.es | 1,055,865 | ▲ 23.03 | |
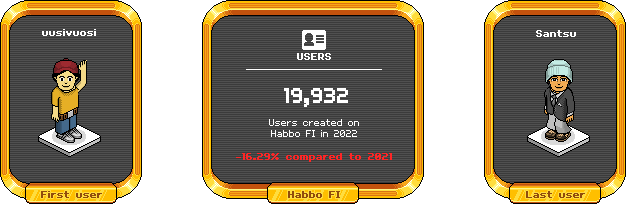
| Habbo.fi | 19,932 | ▼ 16.29 | |
| Habbo.fr | 146,621 | ▼ 14.23 | |
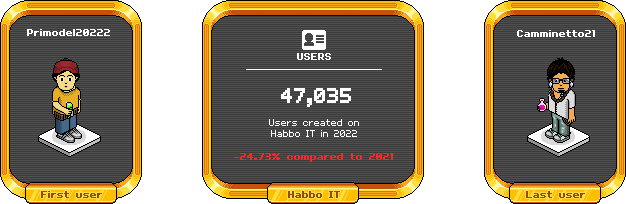
| Habbo.it | 47,035 | ▼ 24.73 | |
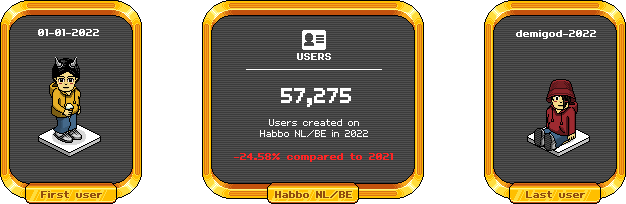
| Habbo.nl | 57,275 | ▼ 24.58 | |
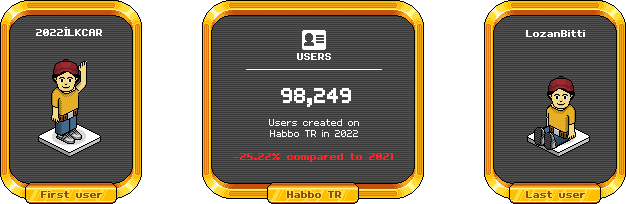
| Habbo.com.tr | 98,249 | ▼ 25.22 | |
| Habbo.com | 402,142 | ▼ 41.03 |
Each user on Habbo can register, in a single email address, 50 avatars, and a single person can register as many emails as he/she wants on Habbo. Like in the past years, there were a lot of reports about robot avatars irregulary created by users, mainly on Habbo.com.br and Habbo.es.
![]() Habbo.com.br
Habbo.com.br
![]() Habbo.de
Habbo.de

![]() Habbo.es
Habbo.es
![]() Habbo.fi
Habbo.fi
![]() Habbo.fr
Habbo.fr

![]() Habbo.it
Habbo.it
![]() Habbo.nl
Habbo.nl
![]() Habbo.com.tr
Habbo.com.tr
![]() Habbo.com
Habbo.com

Groups
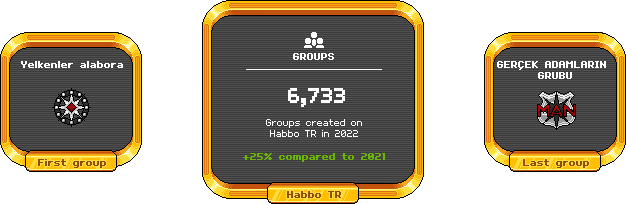
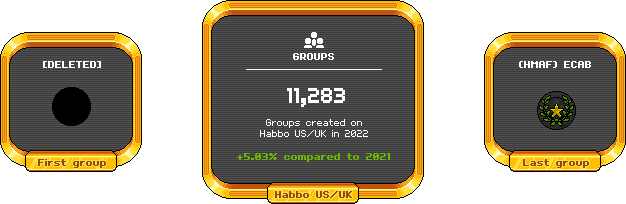
Users are purchasing fewer groups at at least 7 hotels. Only in Habbo.com and Habbo.com.tr increased purchases, this last one most significantly (a 25% increase).
Counting all hotels, 54,334 new groups were created in 2022, a 9.4% decreased compared to the last year.
| Hotel | Total | Oscillation (%) | |
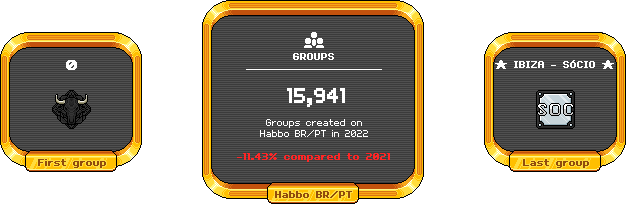
| Habbo.com.br | 15,941 | ▼ 11.43 | |
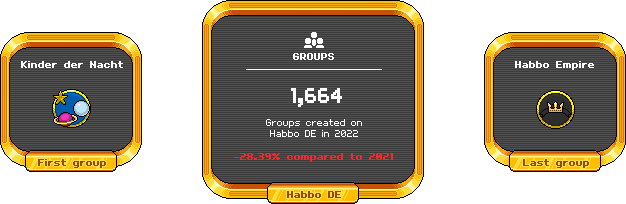
| Habbo.de | 1,664 | ▼ 28.39 | |
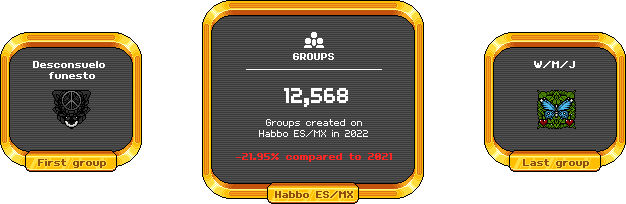
| Habbo.es | 12,568 | ▼ 21.95 | |
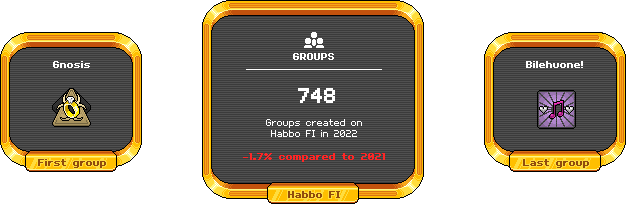
| Habbo.fi | 748 | ▼ 1.7 | |
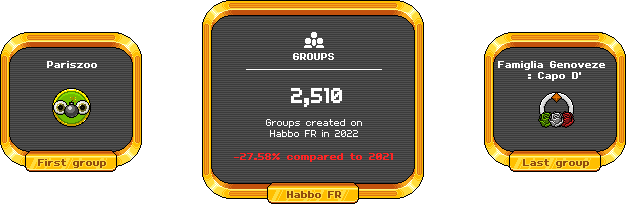
| Habbo.fr | 2,510 | ▼ 27.58 | |
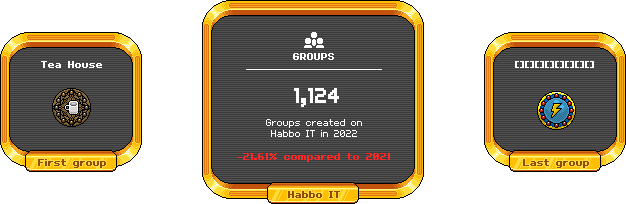
| Habbo.it | 1,124 | ▼ 21.61 | |
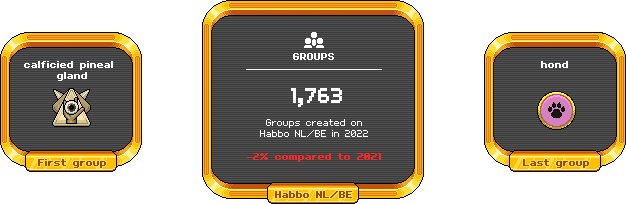
| Habbo.nl | 1,763 | ▼ 2 | |
| Habbo.com.tr | 6,733 | ▲ 25.99 | |
| Habbo.com | 11,283 | ▲ 5.03 |
Since 2011, only Habbo Club members are allowed to buy groups in Habbo. Due to the discounts applied in the sale of groups, it is not possible to identify which groups benefited from the discount and, consequently, the amount of coins paid for the total number of groups informed.
![]() Habbo.com.br
Habbo.com.br
![]() Habbo.de
Habbo.de
![]() Habbo.es
Habbo.es
![]() Habbo.fi
Habbo.fi
![]() Habbo.fr
Habbo.fr
![]() Habbo.it
Habbo.it
![]() Habbo.nl
Habbo.nl
![]() Habbo.com.tr
Habbo.com.tr
![]() Habbo.com
Habbo.com
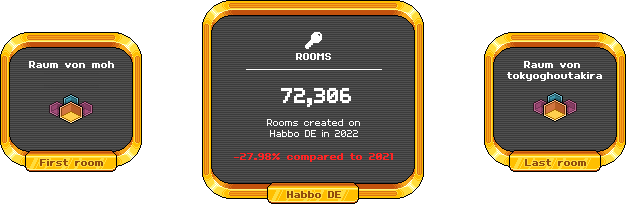
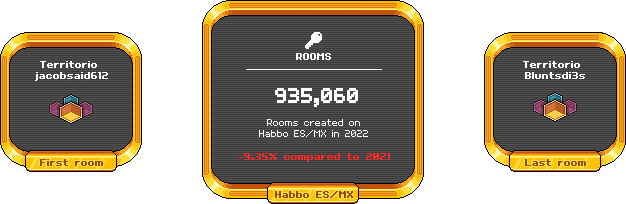
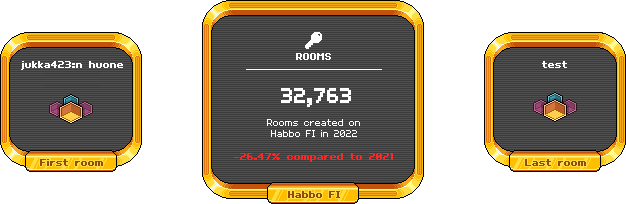
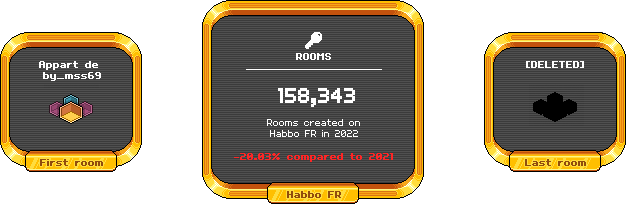
Rooms
If there are fewer registered users, the total of new rooms also decreases. However there are a lot of reasons that can impact the register of new rooms, like active users or room bundles purchased. In the nine hotels, users created 2,805,396 news rooms only in 2022, that is, a 27.89% decrease compared to 2021.
| Hotel | Total | Oscillation (%) | |
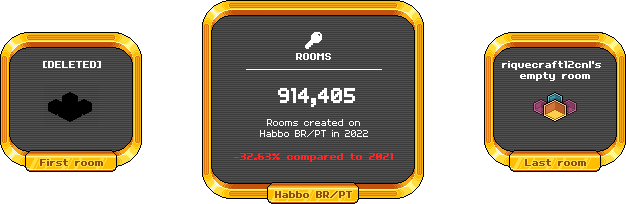
| Habbo.com.br | 914,405 | ▼ 32.63 | |
| Habbo.de | 72,306 | ▼ 27.98 | |
| Habbo.es | 935,060 | ▼ 9.35 | |
| Habbo.fi | 32,763 | ▼ 26.47 | |
| Habbo.fr | 158,343 | ▼ 20.03 | |
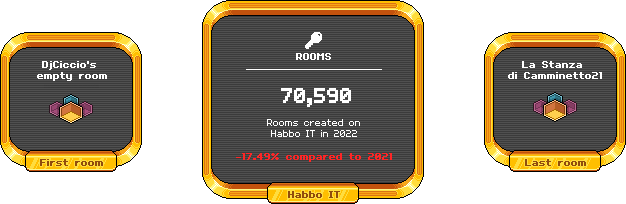
| Habbo.it | 70,590 | ▼ 17.49 | |
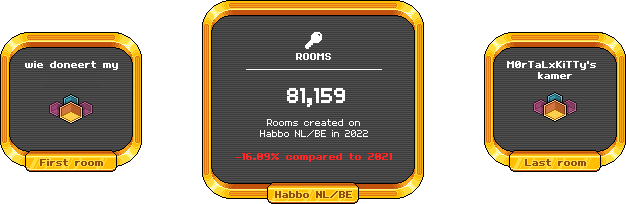
| Habbo.nl | 81,159 | ▼ 16.09 | |
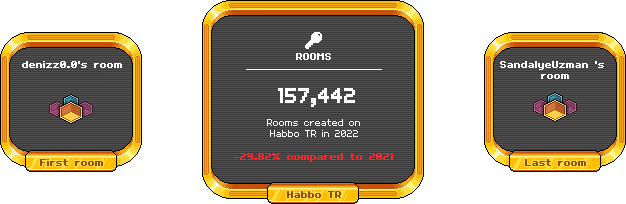
| Habbo.com.tr | 157,442 | ▼ 29.82 | |
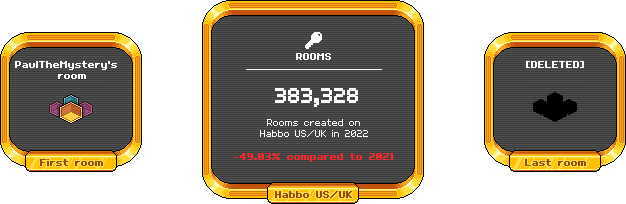
| Habbo.com | 383,328 | ▼ 49.03 |
![]() Habbo.com.br
Habbo.com.br
![]() Habbo.de
Habbo.de
![]() Habbo.es
Habbo.es
![]() Habbo.fi
Habbo.fi
![]() Habbo.fr
Habbo.fr
![]() Habbo.it
Habbo.it
![]() Habbo.nl
Habbo.nl
![]() Habbo.com.tr
Habbo.com.tr
![]() Habbo.com
Habbo.com
Limited Edition Rares
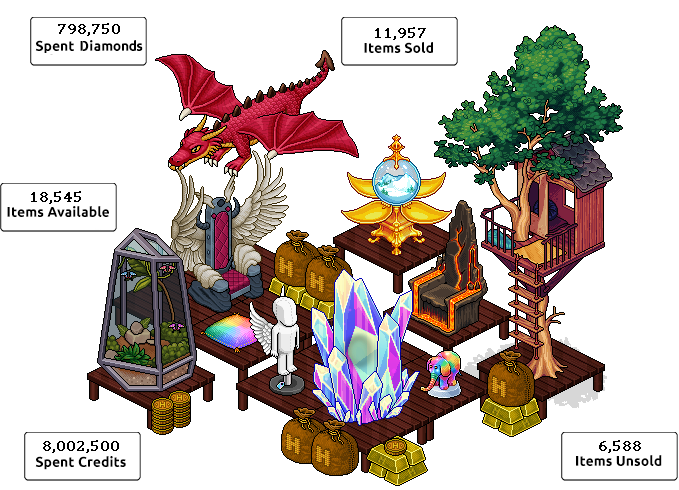
Characterized by high prices and the sale in very limited time and quantity, the Limited Edition Rares had the first big news in ten years: in addition to furniture, clothing is now also sold. Sulake's strategy was a success, as soon as the first rare sold in this format, the Angel Wings, achieved 100% of sales in all hotels.
In 2022, 10 LTDs were made available (the same amount as last year), with a total of 18545 items for sale. Of these, 11,957 were sold, setting a selling rate of 64.48% (in previous year it was 82.12%). Users spent 8,002,500 coins in LTDs, in addition 1 diamond for each 10 coins as a control fee to avoid fraud in the sales.
| Hotel | Items sold | Coins spent | Selling Rate (%) | |
| Habbo.com.br | 799 | 684,000 | 30.09 | |
| Habbo.de | 1206 | 799,000 | 56.89 | |
| Habbo.es | 2131 | 1,441,750 | 66.8 | |
| Habbo.fi | 407 | 266,250 | 76.07 | |
| Habbo.fr | 920 | 608,500 | 58.04 | |
| Habbo.it | 892 | 593,750 | 83.86 | |
| Habbo.nl | 680 | 462,000 | 42.9 | |
| Habbo.com.tr | 1158 | 760,250 | 73.06 | |
| Habbo.com | 3764 | 2,387,000 | 89.19 |
Habbo.com remains the hotel with the best sales. Habbo.de, which historically had good sales, up 80% since 2019, lost the second position to Habbo.it.
SnowStorm players
Back in April 2021, SnowStorm was one of the most asked features to come back to Habbo, but today it is away to be one of the most popular functionalities.
Globally, Snowstorm's average audience was 1845 players per week. The peak was from January 10th to 16th, with 2701 players, while the worst record was from December 5th to 11th, with 1282 players. In percentage terms, the number of players decreased by 65% compared to 2021.
| Hotel | Best Audience | Worst Audience | Average Players | |
| Habbo.com.br | 1214 | 508 | 720 | |
| Habbo.de | 76 | 12 | 28 | |
| Habbo.es | 736 | 333 | 486 | |
| Habbo.fi | 106 | 21 | 42 | |
| Habbo.fr | 205 | 9 | 49 | |
| Habbo.it | 257 | 31 | 148 | |
| Habbo.nl | 100 | 10 | 43 | |
| Habbo.com.tr | 208 | 36 | 101 | |
| Habbo.com | 344 | 84 | 219 |
Of the 52 weeks of 2022, Habbo.com.br led as the best audience in 51, while Habbo.es had the best audience from May 2nd to May 8th. For 27 weeks, Habbo.de had the worst ratings, followed by Habbo.fr in 10 weeks.
In September, Puhekupla published a thread on Twitter of an analysis of data extracted from SnowStorm since its relaunch. Data showed a gradual downward trend in audience since 2021, with an extreme peak only in the premiere week, where close numbers were never repeated.